A Tale of Optimisation using Craft CMS
As developers we have all been there, you have a site and people complain its slow. So where do you start? There are different levels of optimisation as well as various tools for front and back end optimisation. Some changes will have a big impact on performance, whilst others may not be really noticeable (unless you are interested in a performance score, for example}.
We recently took over development of a Craft Commerce site (v2), which is never easy as you don’t know the history of why something was done in a certain way. This is not a naming and shaming exercise, it’s just an opportunity to run through some optimisation examples of what you can check and how to fix them. (A disclaimer here, this is just optimising existing code, not a reworking/refactoring exercise).
So overall the site wasn’t actually performing that badly – most of the time. For the improvements we are going to look into a specific category page, this page loaded at around 700ms, so I know what you are thinking, what’s the problem? The problem occurred when you tried to update products in the CMS. At this point the site slowed down considerably, we found out this was because it was heavily cached.
When the cache had been cleared it rose to 3.81 seconds – so over three second slower on the live site. The site cache over a period of time would get bigger and bigger, so every time you needed to clear the cache it took longer and longer. At one point the caching table was at 1.6GB, about a third of the size of the whole database. This has subsequently changed to use Redis, but shows how cache can get out of control when left unmonitored.
To get a clearer picture of what was happening, I removed all the caching elements throughout the site. Caching is not just a get out jail free card, it has overheads as well, not just in terms of getting the cached data but about clearing the cache as well. Here are a few code examples
So, there were several instances of caching around just plain html, here is one example
{% cache globally unless currentUser %}
                 </ul>
             </div>
         </nav>
     </header>
{% endcache %}
In these cases, its actually more expensive to use the caching.
The next example is a case of redundant code. This is found in the site’s main navigation, which is cached globally – this means that it will only cache globally for the site local rather than one per URL. So this seems fair enough, however it’s also getting the top-level categories and the sub categories, again fair enough, however the class the JavaScript relied on to display the sub navigation as a dropdown had been removed. In this case, the dropdown navigation was not required so I just removed the sub category navigation functionality and as previously mention removed the caching. It’s now dynamic and won’t be much difference in terms of performance as the cache version.
{% cache globally %}
    {% set productTypeList = craft.categories.group('productCategories').level(1) %}
    {% for productType in productTypeList %}
    {% set parentCat = craft.categories.slug(productType.slug).first() %}
    {% set cat = productType.getDescendants(1) %}

    <li class="text-center whole gapless {{ (cat|length) ? 'parent' : '' }}" itemprop="name">
        <a itemprop="url" href="/{{ productType.slug }}" class="color-whiter no-margin-right no-padding-right whole gapless color-white-hover color-blue-bg-hover color-grey-15-border weight-semi color-black-75 slight-small no-underline-hover height-full align-center flex flex-row"><span class="whole gapless"  itemprop="name">{{ productType.title }}</span></a>
            {% if cat|length %}
                <div class="whole color-grey-15-bg pos-abs whole gapless shado hidden" data-missing-class="dropdown">
                    <div class="container">
                        <p class="header-font color-black large weight-bold text-left">Shop by {{ productType.title }}</p>
                        <ul class="children no-padding-total flex columns">
                            {% for children in cat %}
                                <li class="text-left" itemprop="name">
                                    <a itemprop="url" href="{{ children.getUrl() }}" class="text-left color-white color-white-hover color-blue-bg-hover color-grey-15-border weight-semi color-black-75 slight-small no-underline-hover height-full flex flex-row"><span class="whole gapless"  itemprop="name">{{ children.title}}</span></a>
                                </li>
                            {% endfor %}
                        </ul>
                    </div>
                </div>
            {% endif %}
        </li>
    {% endfor %}
{% endcache %}
It’s worth reading and understanding fully how the cache works https://docs.craftcms.com/v2/templating/cache.html before implementing it. Caching should not be used to mask underlying performance issues. It never ends well. You just end up moving the issue elsewhere in the site.
Debugging in Dev mode
So now the cache is removed the next thing I did was to enable debugging on the site to see what was actually going on.
craft > config > general.php
Enable devMode i.e.
‘devMode’ => true
One thing to remember is, when testing the load times again remember to disable the dev mode as it does slow down the page. More information about dev mode can be found here https://craftcms.com/guides/what-dev-mode-does
Now when browsing the category page in the Console tab of developer tools, some debug information will magically appear.
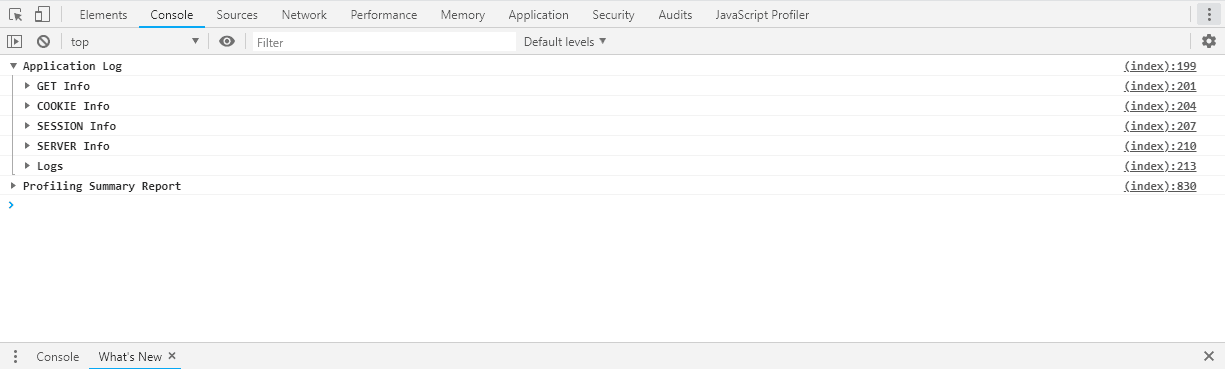
Under the Profiling Summary Report there is a few stats that we can have a look at. The one that stood out was the Total Queries, 248 of them. Now I know that off the shelf CMS’s have overheads but 248 for 57 products in this case seemed excessive. I’d also point out just because there is a large amount of database queries, it doesn’t automatically mean there is something wrong or that it will slow down the site.
The site templates are split into core components, the main template has a header and footer template and the category page just extends that. Commenting out the main template and checking the console again, it reduced it to 33, so that will be the various plugins and in-built queries for that page, but at least we know that the rest are in the templates themselves. Commenting out just the footer and a CTA block reduced the number of database calls by 22.
At the bottom of each page there are some social links, these are editable in the CMS. Below is an example of one of the social links:
{% if socialLinks.social[0] is defined and socialLinks.social[0].socialLink.url is not empty %}
    <li class="quarter flex align-center">
        <a href="{{ socialLinks.social[0].socialLink.url }}" {{ (socialLinks.social[0].socialLink.target|length)? ' rel="noopener" target="_blank"' : '' }} class="display-block whole flex align-center flex-cols">
            <img class="whole" src="/assets/imgs/social/fb.svg" alt="Facebook" />
        </a>
    </li>
{% endif %}
Personally, I think this is a bit over kill, I can’t really see the need to ever update the social urls, if it did happen then it’s not a big job to go into the template and manually change it. I didn’t want to remove CMS functionality so I decided just to cache the whole footer which did include some navigation pulled in from the CMS. Strangely looking back at the history this section was never cached originally.
Eager loading
The bulk of the 248 queries were related to the actual category page itself, which makes sense.
Looking through the code I found the following, which just grabs all the products from the category. It doesn’t have a limit on it because looking through the code further it uses the data to create the filters on the category page. (Not the way I would do it, but rewriting the filters in not in the scope of this development phase)
{% set products = craft.commerce.products.relatedTo(category).limit(null) %}
Now looking at what data the filters need, it requires the category information, brand (which is also set up as categories) and images. Here comes eager loading to the rescue https://docs.craftcms.com/v2/templating/eager-loading-elements.html
{% set products = craft.commerce.products.relatedTo(category).with(['mainImage','productCategories','productBrand','variants']).limit(null) %}
Then changing a few other lines like this because it’s changed from an object to and array
{% set image = product.mainImage.first() %}
to
{% set image = product.mainImage[0] %}
Checking the console again, the number of queries went from 248 to 78. Not bad for changing a few lines of code.
I did the same with other templates throughout the site, some had bigger savings than others but all worthwhile doing.
Imager
A couple of things to mention here, this site is using the imager version one with imagick, so may differ slightly if using version two or using gd.
The next thing to look at was images. The site uses imager https://github.com/aelvan/Imager-Craft, and looking through the code there was a lot of transformations going on. Some were related to an SEO plugin, but looking through the homepage code there was the following options set up for imager
[
    { width: 1920, height: 1080, jpegQuality: 100 },
    { width: 1650, height: 442, jpegQuality: 100 },
    { width: 1200, height: 321, jpegQuality: 90 },
    { width: 1000, height: 268, jpegQuality: 90  },
    { width: 800, height: 339, jpegQuality: 90  },
    { width: 600, height: 254, jpegQuality: 90  },
    { width: 400, height: 170, jpegQuality: 90  },
    { width: 300, height: 140, jpegQuality: 90  }
]
That’s eight images for the homepage scrolling banner, and there are three banners in total (at this point in time). Every time a new banner gets uploaded in the cms it has to resize it eight times. In this case, what is the advantage of serving an image 300 and 400 pixels wide? It can be a big drain on server resources to resize images on the server. You can adjust things like the max execution time memory limit but you need to remember the consequences. I think the lesson here is just to be sensible with the number of resized images.
Other things to look at is the config for imager, this can be found in
craft/config/imager.php
Some defaults had been changed already
return [
  'cacheDuration' => 31536000,
  'resizeFilter' => 'hermite'
];
The cacheDuration is a year, there is no point resizing images every 14 days if there is no need to, in this case the images are not going to change that often if ever.
The resizeFilter is the filter used by imagick, all the different options can be found here https://github.com/aelvan/Imager-Craft#resizefilter-string with the different performances, its all a case of weighing up performance vs quality of image.
Other things to consider
removeMetadata – If you are using imagick then setting this to true will strip meta data from the image resulting in smaller file size
jpegoptimEnabled/optipngEnabled – If you have jpegoptim and/or optipng installed then you can enable them by setting these options to true, by default these will be run as a job rather than at runtime. However just like the resizing images on the server, optimising images on the server can also take up lots of server resources. Again, just be sensible.
WebP – Imager also supports saving images in webp format, https://github.com/aelvan/Imager-Craft#usecwebp-bool big savings can be made in terms of image size, you can see some examples here https://developers.google.com/speed/webp/gallery1 There are two options with this, if your imagick is compiled with webp then it will just work (you can check by having a look at your php info and under ImageMagick supported formats it will say webp if its supported), otherwise you can set useCwebp to true and that will use cwebp command line tool (you will need it installed https://developers.google.com/speed/webp/docs/compiling#unix) which is slightly slower.
In conclusion
It maybe took a day or two to complete all the changes including testing, but it was well worth it. It shows what can be done, in this case with some very small tweaks. Sometimes you may be able to find the issues quite quickly and get some quick wins like the ones I have mentioned, other times you won’t be able to. I think the main thing to take from this is don’t just turn to cache to fix issues, there is nothing wrong with cache when used correctly but caching to mask issues will just cause headaches down the line.