Our Need for Speed: Part 2
Last week I wrote about our efforts in speeding up the David Naylor website in an attempt to get a perfect 100 out of 100 score on Google PageSpeed Insights (GPSI). We got close but we’re stuck on one last problem; server response time.
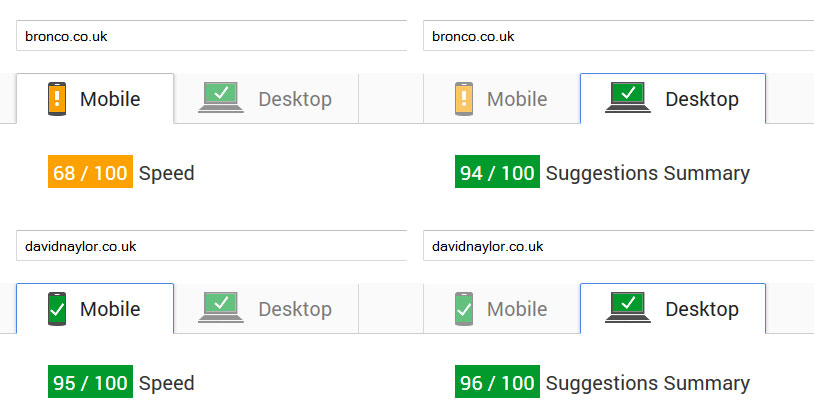
We’ve improved things a little since last week and now score 95 on mobile and 96 on desktop but still not perfect… yet.
After I wrote that post I put Dave’s site to one side while Ben took over to see what server improvements could be made and I moved onto the Bronco website to see what we could do there. With the exception of installing mod_pagespeed I took a more manual approach to changes this time around. In this instance I wanted to consider each technique individually and its impact on speed as well as its impact on the future maintenance of the website.
Google PageSpeed Insights Score
If you go to GPSI you’ll notice the score we achieved for Bronco is much lower than that we achieved for Dave’s website, especially on mobile. There are a few reasons for this:
- Google Maps – Including maps on our homepage have us falling fowl of browser caching and image optimisation requirements. Pretty annoying really.
- Prioritise above the fold content – If we did this we’d be looking for a manual solution and so far the techniques just seem a little green and with the discussion still ongoing we’re not able to make a well informed decision on implementing this technique.
- We gave up chasing a high score
As we tested the speed of ours and other websites we discovered that the GPSI score doesn’t tell the whole story and a high score here doesn’t necessarily mean you have a fast website. Instead we focused on much more important metrics such as first byte, start render and load times.
Load Times
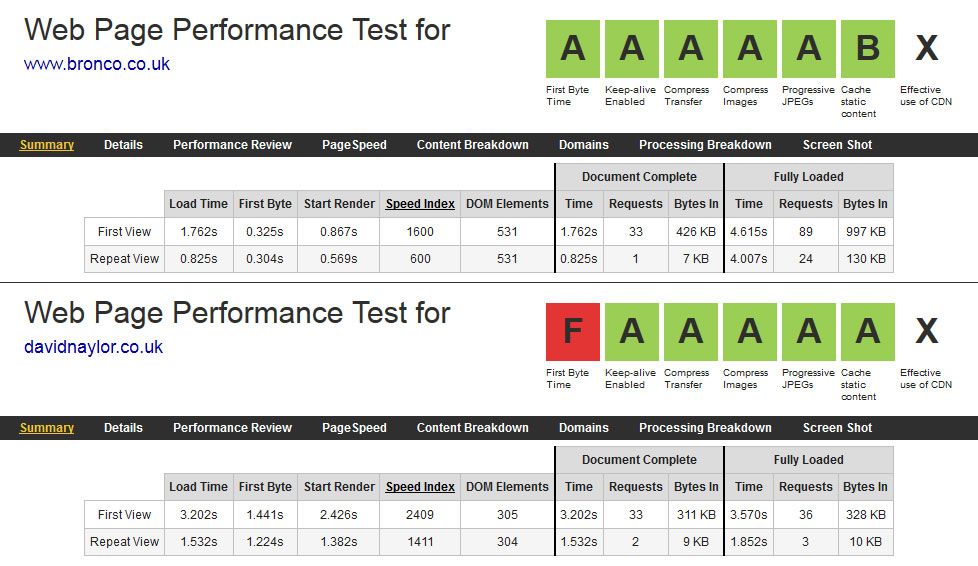
When using WebPageTest to analyse the load times of Bronco and David Naylor you can see below that while Bronco has a poorer GPSI score it’s the faster website; loading twice as fast and 4 times quicker to first byte.


So what causing the difference? Well as two different websites it’s tricky to make a comparison. Luckily for this post we notice that the Bronco blog is running just as slow as Dave’s website; so we’ll compare our homepage and blog pages as they’re much more alike.

Our homepage and our ideas pages have some small differences that could contribute to differences in load time but the biggest difference on the Our Ideas page and something it has in common with Dave’s website is that they both run on WordPress.
The bulk of our website doesn’t use WordPress and is a bespoke build mixing static and database stored content. Both pages use the same CSS files and the same core JavaScript files as well as having comparable use of imagery and RSS Feeds.
The big difference, and what we think the cause of the 4 second difference in load time, is WordPress, its plugins and how it retrieves information from the database. I understand some might argue there are certain differences between the two pages that will contribute to different load times but I don’t think these could cause the difference in load time we’re experiencing.
While WordPress is a wonderful and powerful system it’s maybe not the best thing to use for the speed conscious, though understanding the optimisation techniques available you can speed up WordPress greatly.
Done?
So with a fairly respectable load time and a less than average GPSI score are we looking to continue to optimise our website?
For the moment I’m going to say no. I don’t think there’s much more we can do without adversely affecting how we edit the website in future and we only have a limited about of time available to spend on wringing out small millsecond gains in speed.
Comparisons
Lastly we’re fairly happy with how we compare with other digital agencies on the speed front. In testing our website we looked to other digital agencies to see how ours performed in comparison . It’s by no means the only way in which we judge ourselves but we were a little taken aback by just how well we compared to other agencies.
Of the handful we looked at only a few showed comparable speeds with many slower than our blog which is the slowest page in our website.
If in the future we can make our site faster then we will do but for now it’s nice to know we’re somewhat ahead of the game and in reaching a load time of ~1.7 seconds we’ve made a good step forwards for people coming to our website.
Note: All the figures stated in this post for load times and Google PageSpeed Insights are fairly fluid and can alter somewhat when re-tested.
Share this article
Like what you’ve read, then why not tell others about it... they might enjoy it too
We'd love to hear from you!
If you think Bronco has the skills to take your business forward then what are you waiting for?
Get in Touch Today!
Discussion